Wall Street is selling gold and silver to retail investors: Since Q2 2025, retail investors have bought +$70 billion in gold ETFs. These purchases have more than TRIPLED over the last 6 months. Over the same period, institutional investors have sold -$1 billion with outflows accelerating in late January after gold prices crashed -20% in just 3 days. Meanwhile, silver ETFs have recorded +$10 billion in retail purchases over the last year. Over the same time period, institutions have sold -$200 million. Retail investors are all-in on precious metals.
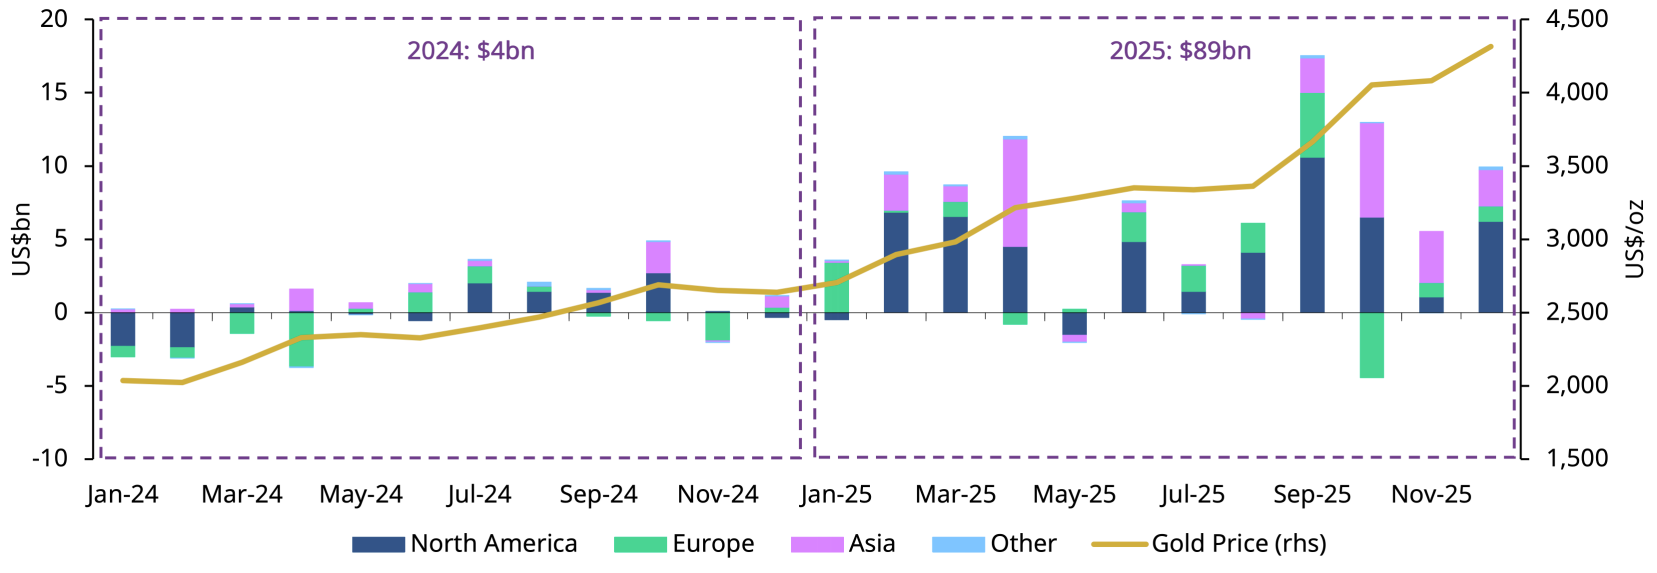
This World Gold Council chart visualizes monthly regional flows into gold ETFs alongside the gold price for 2024–2025, highlighting record inflows in 2025 (US$89bn) led by North America. It directly illustrates the surge in ETF buying after Q2 2025 that underpins the claim that investors—particularly retail—piled into gold ETFs.
Source: World Gold Council
Research Brief
What our analysis found
Precious metals ETFs have experienced a historic surge in inflows since mid-2025, with gold ETFs attracting record-breaking capital month after month. According to the World Gold Council, global gold ETFs recorded +$26 billion in Q3 2025 alone — the largest quarter on record — anchored by a $17.3 billion inflow in September 2025. Inflows continued through the end of the year and into early 2026, with January 2026 setting yet another record at approximately +$19 billion in net inflows, pushing total assets under management to roughly $669 billion. By February 2026, AUM reached an all-time high of approximately $701 billion with holdings at 4,171 tonnes.
Silver ETFs have also seen notable activity. The iShares Silver Trust (SLV) pulled in +$2.3 billion year-to-date through early December 2025, and Vanda Research flagged record single-day retail net buying of SLV at $171 million on January 27, 2026 — surpassing even the 2021 Reddit-fueled frenzy. However, silver flows have been far more volatile: S&P Global reported that SLV experienced roughly $3 billion in net outflows in January 2026 amid a dramatic crash, and ETFDB data shows SLV's one-year net flows at only about $2 billion as of early March 2026, well short of the $10 billion figure cited in the viral tweet.
The late-January 2026 precious metals crash was severe but nuanced. On January 30, gold dropped approximately 9% in a single session while silver plunged a record 26% in one day. Over the period from January 29 to February 2, gold's peak-to-trough decline reached roughly 21%, broadly consistent with the tweet's "20% in 3 days" claim depending on the exact timestamps used. Crucially, while the tweet attributes buying to retail investors and selling to institutions, the World Gold Council does not break down ETF flows by investor type — and S&P Global actually identified institutional and macro-oriented investors as key buyers of GLD during January 2026, directly contradicting the tweet's central narrative.
Fact Check
Evidence from both sides
Supporting Evidence
Record gold ETF inflows in late 2025 and early 2026
The World Gold Council confirmed that gold ETFs attracted approximately $26 billion in Q3 2025, followed by continued monthly inflows through December 2025 (+$10 billion) and a record-setting January 2026 (+$19 billion). The broad direction of massive capital flowing into gold ETFs is well-documented.
Retail silver ETF buying surged to record levels
Vanda Research, as reported by Reuters, found that U.S. retail net buying of SLV reached $171 million on January 27, 2026 — the largest single-day retail inflow on record, exceeding 2021 levels. Multiple outlets described the silver trade as "crowded" with retail participation.
Gold price crash of approximately 20% is broadly accurate
S&P Global documented a peak-to-trough decline of roughly 21% in gold from January 29 to February 2, 2026, while silver fell approximately 32% in the same window. The Straits Times reported gold's single-session drop at around 9% on January 30, with silver plunging a record 26% that day. The tweet's framing of a 20% gold crash over a few days is directionally consistent.
Investors bought the dip during and after the crash
The World Gold Council noted that investors outside Europe continued to buy gold ETFs on January 30 and February 2 — the crash and immediate recovery days — supporting the notion that buyers remained active throughout the volatility.
Contradicting Evidence
No verified breakdown of "retail vs. institutional" ETF flows exists
The World Gold Council reports gold ETF flows by fund and region, not by investor type. The tweet's claim that "retail investors bought +$70 billion" and "institutional investors sold -$1 billion" cannot be verified from any publicly available WGC or ETF sponsor data, making this central framing unsubstantiated.
S&P Global identified institutional buyers, not sellers, in January 2026
Contrary to the tweet's assertion that institutions were net sellers, S&P Global reported that GLD attracted approximately +$2 billion in net inflows in January 2026 "particularly from institutional and macro-oriented investors," directly contradicting the claim of institutional outflows.
Silver ETF flows fall far short of the claimed $10 billion
ETFDB data from early March 2026 shows SLV's one-year net flows at approximately +$2.02 billion. Even including SIVR and smaller silver ETFs, publicly visible totals appear well below the $10 billion retail purchase figure cited in the tweet. Additionally, S&P Global documented approximately $3 billion in net outflows from SLV during January 2026 alone.
The "3 days" framing of gold's 20% crash requires selective timing
Gold fell about 9% on January 30 in a single session. The roughly 21% peak-to-trough decline documented by S&P Global spanned from January 29 to February 2 — a period that, depending on how one counts trading days and timestamps, stretches beyond a strict three-day window. The claim is directionally accurate but imprecise.
European outflows complicate the "retail all-in" narrative
While North American and Asian investors added to gold ETFs throughout late 2025 and early 2026, Europe recorded persistent outflows — including -$4.5 billion in October 2025 alone — suggesting the buying trend was regionally uneven rather than universally "all-in."
Report an Issue
Found something wrong with this article? Let us know and we'll look into it.