STOCK MARKETInfographic
5 min read
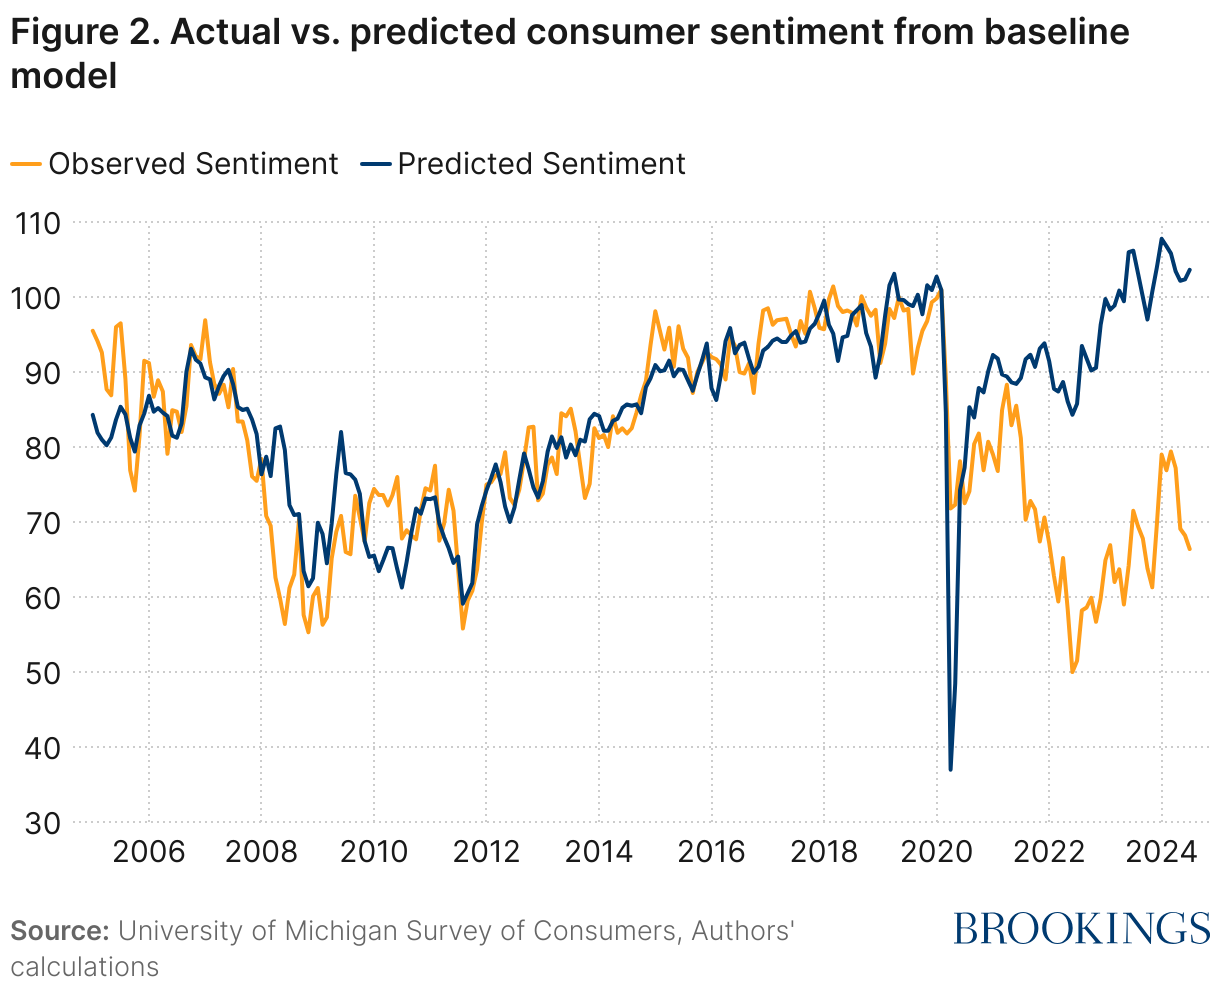
Why Strong U.S. Data Meets Weak Consumer Sentiment
Analysis of the 2024 U.S. paradox: unemployment at 3.8% and stocks up, yet household sentiment stays low. We dissect data, income, inflation and survey biases.
Latest insights and analysis in stock market sentiment and public opinion.
Analysis of the 2024 U.S. paradox: unemployment at 3.8% and stocks up, yet household sentiment stays low. We dissect data, income, inflation and survey biases.
Breaking: Tweet says GameStop ($GME) may offer to buy eBay. Public reaction split ~32% supportive vs ~33% confronting; comments show mixed views and reactions.
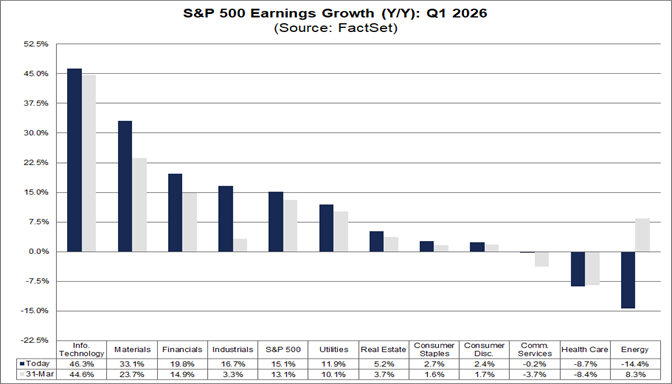
Q1 2026 earnings outpaced forecasts: S&P's +13.2% estimate rose to a 15.1% blended gain by late April (28% reported), with IT projecting a 45% jump on cloud.
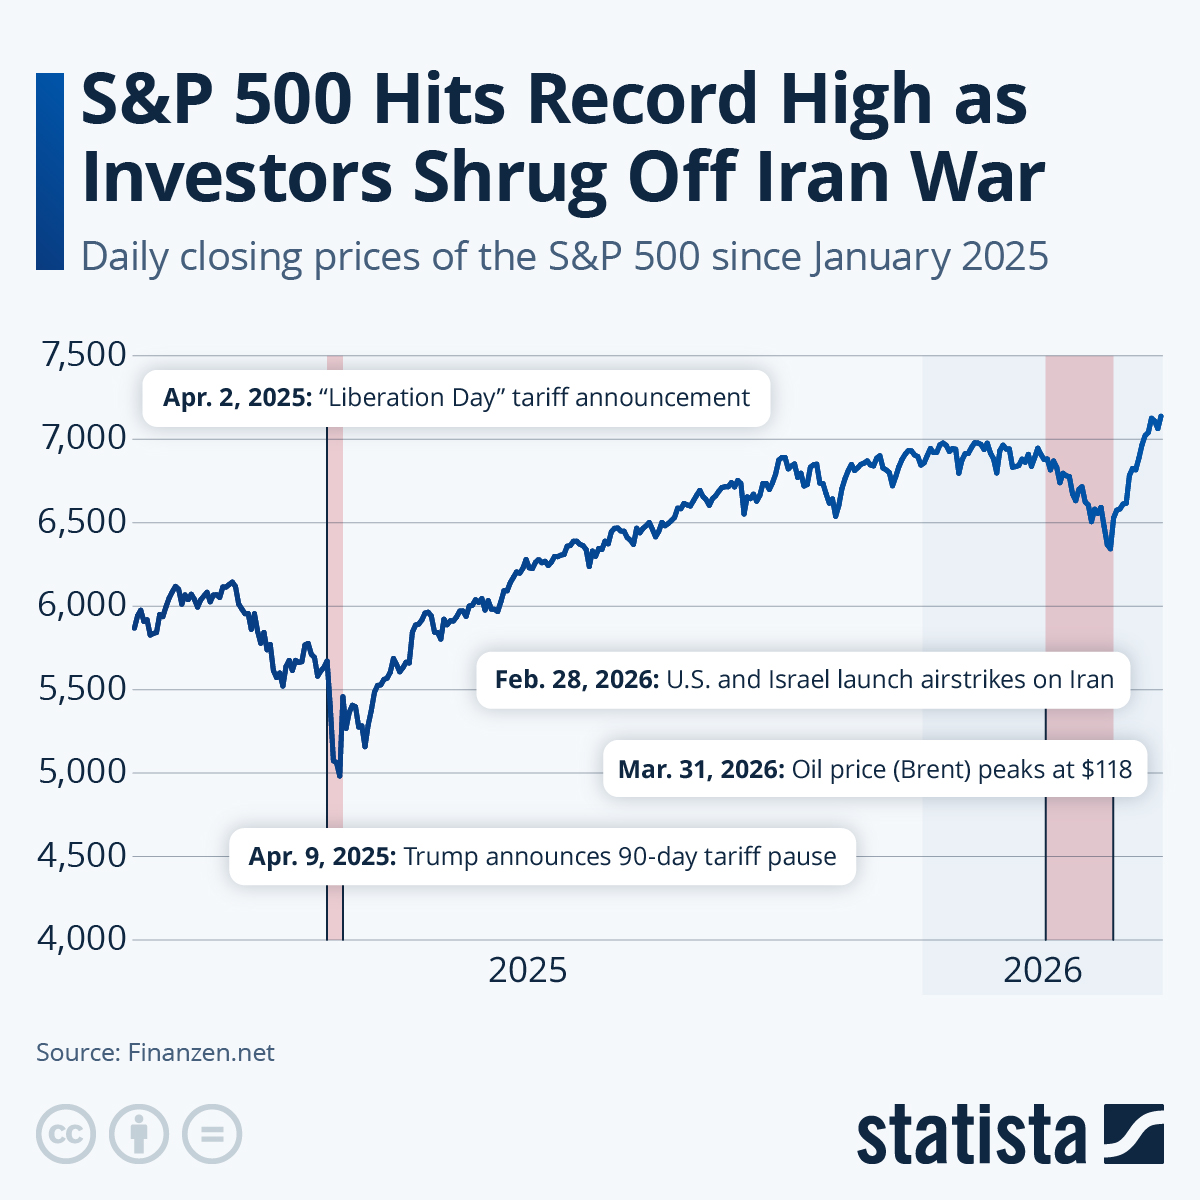
Analysis: S&P 500 closed at a record 7,209–7,210 on April 30, 2026, rising 1.02% that day and surging 10.4% in April — its strongest month since Nov 2020.
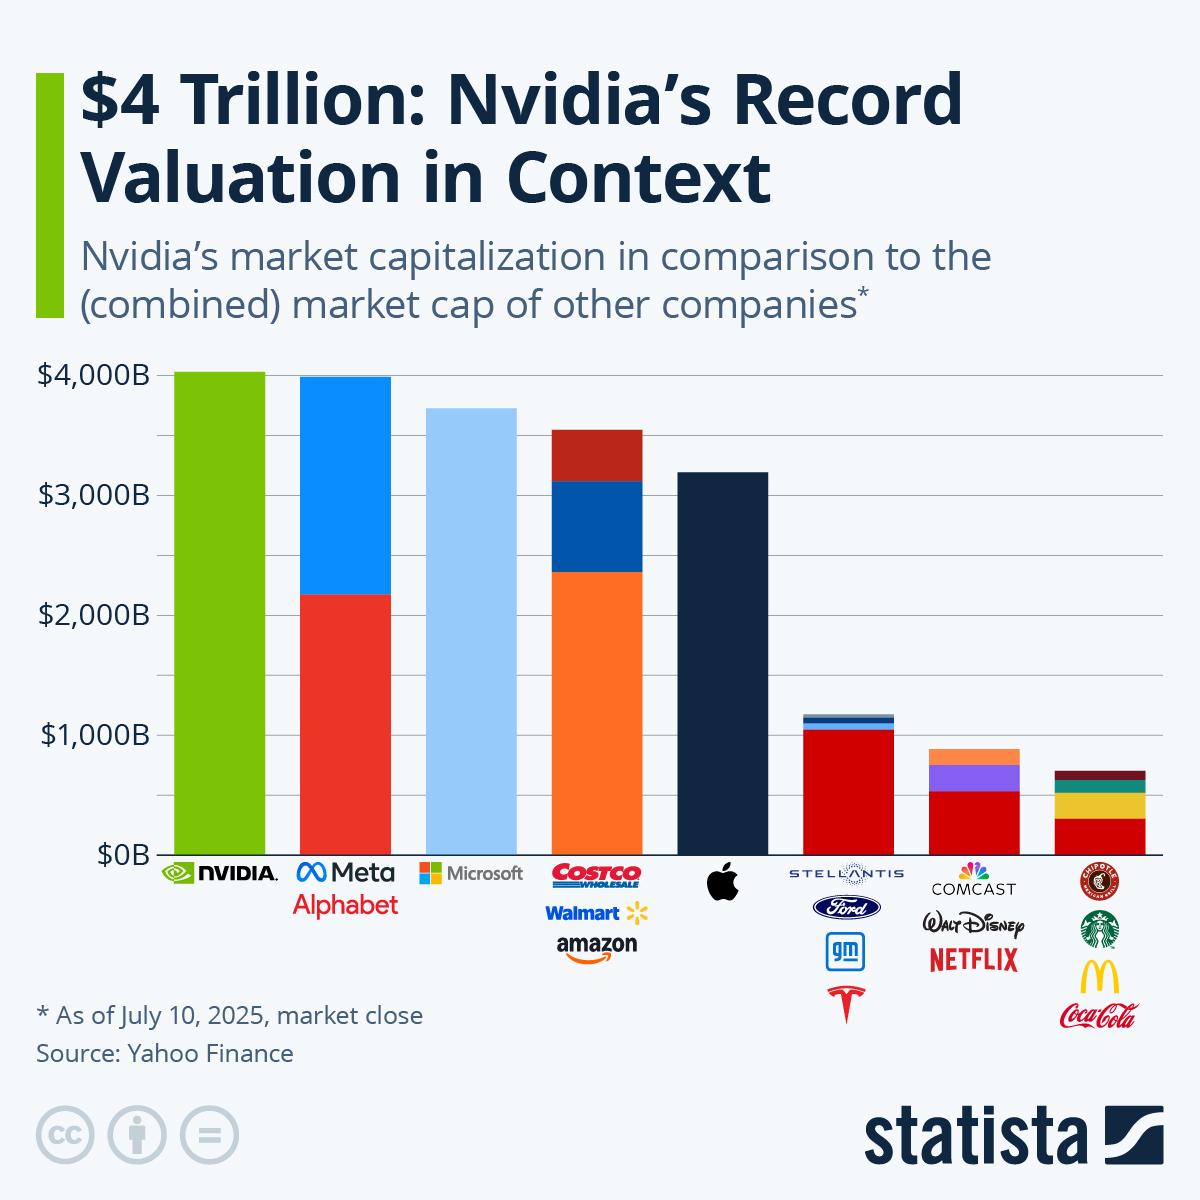
Analysis of Alphabet’s $420B single-day market-cap surge: what drove the 5.7% jump, lifting valuation to ~$4.5T and leaving it ~6% shy of Nvidia’s ~$4.9T.
Viral Trump tweet claims a $30B gain from buying Intel ($INTC) in Aug 2025. Sentiment: 21.76% support vs 46.47% confronting — replies show mixed reactions.

Analysis of Meta's Q1 results and Q2 revenue guidance ($58-61B), FY capex outlook, and ad metrics - implications for growth, margins, and investor expectations.
Tweet sentiment on $HOOD: 55.10% support, 18.37% confrontation. Analysis flags missed international stock trading, retail losses, and strategic product missteps.

Analysis of Spotify's Q1 2026 results: EPS beat, revenue in line, and MAUs rose to 761M. Key trends and insights on growth, monetization and outlook today.
Towa (6315) tweet analysis: seen as a monopoly in HBM4 molding. Major memory customers and rising AI-driven capex push support (40.82%) vs confront (10.20%).
Tweet analysis: 40.6% support vs 9.4% confront — AMD likely filled TSMC capacity vacated by Qualcomm/MediaTek, driving older-node CPU demand and better earnings.
Sentiment analysis of a viral tweet on Michael Burry vs Nvidia: 52.38% supportive, 31.48% confronting. Explore context, evidence, and prevailing public opinion.

S&P 500 headcount fell ~400,000 in 2025 to 28.1M, the first annual drop since 2016. Tech and logistics cuts drove declines; layoffs are set to continue in 2026.

Analysis of Elliott's ~11% stake in Southwest, board changes, and ticket-price comparisons that reveal how activist pressure could reshape fares, seating, fees.
Tweet analysis: 67.3% supportive sentiment toward a trader's catalyst-driven long strategy. Covers timing around catalysts, news, entry points, methods, risks.
Analysis of tweet on Cathie Wood buying ~$73M of AMZN: 25.86% supportive vs 31.90% confronting. Mixed reactions include quoted supportive and confronting replies.
Tweet analysis: Michael Burry's new long in MSFT sparks mixed reactions - 19.78% supportive vs 31.87% confronting. Read the sentiment breakdown and key takeaways.
Tweet analysis: a Turkish brokerage's 40,000% surge draws regulatory scrutiny. Twitter sentiment: 42.86% supportive, 21.43% confronting — polarized reaction.
Analysis of tweets on $NOW after CEO's $3M buy at $104: 59% supportive, 26% confrontational. Investors discuss basis, options strategies, and market sentiment.
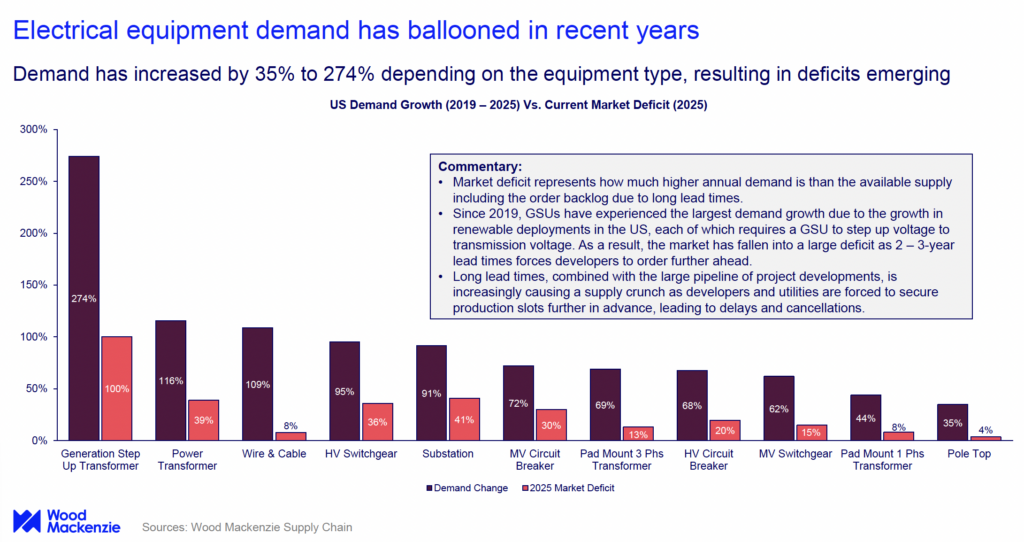
Data analysis of the Defense Production Act's impact on U.S. grid supply: sectors and company winners, expected DOE awards, timelines, and market effects.
POET up 20.2% pre-market after 'far in excess' purchase orders and MRVL supplier ties. Signals material SIVE laser production growth markets may not yet price.
Tweet: Trump extended a ceasefire pending Tehran's proposal and talks. Sentiment analysis shows ~10.27% support, ~63.01% confront—markets turn bullish.
Sentiment analysis: Claude's tweet shows 39.68% supportive, 19.05% confronting. Key actions: bought $RDDT, sold $BAH, portfolio +8% with adjusted allocations.

Apple under Tim Cook: market cap rose from $350B to $4T and revenue hit $416B. Analysis of price-to-sales expansion, key drivers, and market implications.
ASTS fell ~15% after Blue Origin's BlueBird 7 ended in a too-low orbit despite separation. Insurance should cover it. Sentiment: 47.8% support, 22.2% confront.
Analysis of a tweet claiming a Trump 'emergency' announcement: support 14.47%, confront 48.68%. High confrontation suggests skepticism and potential market panic.
Analysis: BOJ sold ¥330.8B in U.S. Treasuries. Sentiment — Support 21.59%, Confronting 48.86%. Read reactions, market risks, and what could happen Monday.
Tweet comparing today's $SPY to the dot-com bubble drew mixed reactions: 34.82% supportive, 33.18% confronting. Nearly even split in investor sentiment.
59.64% support, 11.57% confront. Proposal: semi-monthly dividends for $STRC—no annual rate change—to stabilize price, dampen cycles and boost liquidity.
Tweet reports Intel shares have reclaimed losses from the 2000 dot-com bubble. Sentiment: 40.10% support, 26.09% confront. Reaction analysis and implications.
Netflix (NFLX) falls 9% after earnings. Sentiment: 57.49% supportive vs 9.58% confronting - multiple supportive and confronting replies appear in the tweet.
Analysis of a viral Trump tweet claiming the biggest tax cut: 14.59% supportive vs 67.37% confrontational. Sentiment breakdown, market impact, and key quotes.

Analysis of Druckenmiller's 1999 $600M short loss: timeline, position sizing, short-squeeze data, and risk lessons for portfolio managers & traders with takeaways.
Tweet analysis: Allbirds jumps 910% in one day. Public sentiment is supportive (66.09%) with low confronting share (9.77%). See reactions and implications.
Allbirds' pivot from shoes to AI and a +200% stock surge provoked mixed Twitter reaction: 37.05% supportive, 23.32% confronting and ~39.63% neutral. Read full thread.
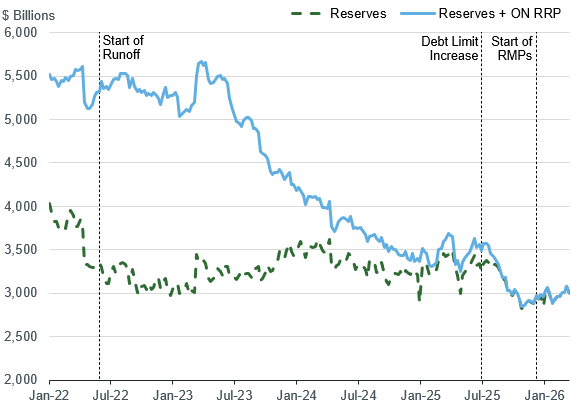
Data-driven analysis of the Fed's Dec 12, 2025 reserve-management purchases (~$40B/month): implications for liquidity, yields, markets and monetary policy.
Analysis of a Trump Oval Office tweet announcing a possible Iran peace deal. 11.8% supportive vs 61.5% confronting - shows skepticism and market impact.
Sentiment analysis of a tweet about Iran sinking a US carrier: 26.32% supportive, 44.74% confronting. Reviews public reaction and market and oil effects.

Data-driven analysis of President Trump's 'greatest stock market' claim. We evaluate the S&P 500's 7,000 milestone, returns, inflation and policy effects.
Breaking tweet: Trump to speak 6:00 PM ET — predicts Iran peace deal and ceasefire. Sentiment: 10.05% support, 66.40% confront; markets may surge tomorrow.
Sentiment analysis of Trump's tweet linking nuclear threats to market drops: 62.14% confronting vs 25.10% supportive, highlighting public backlash and themes.
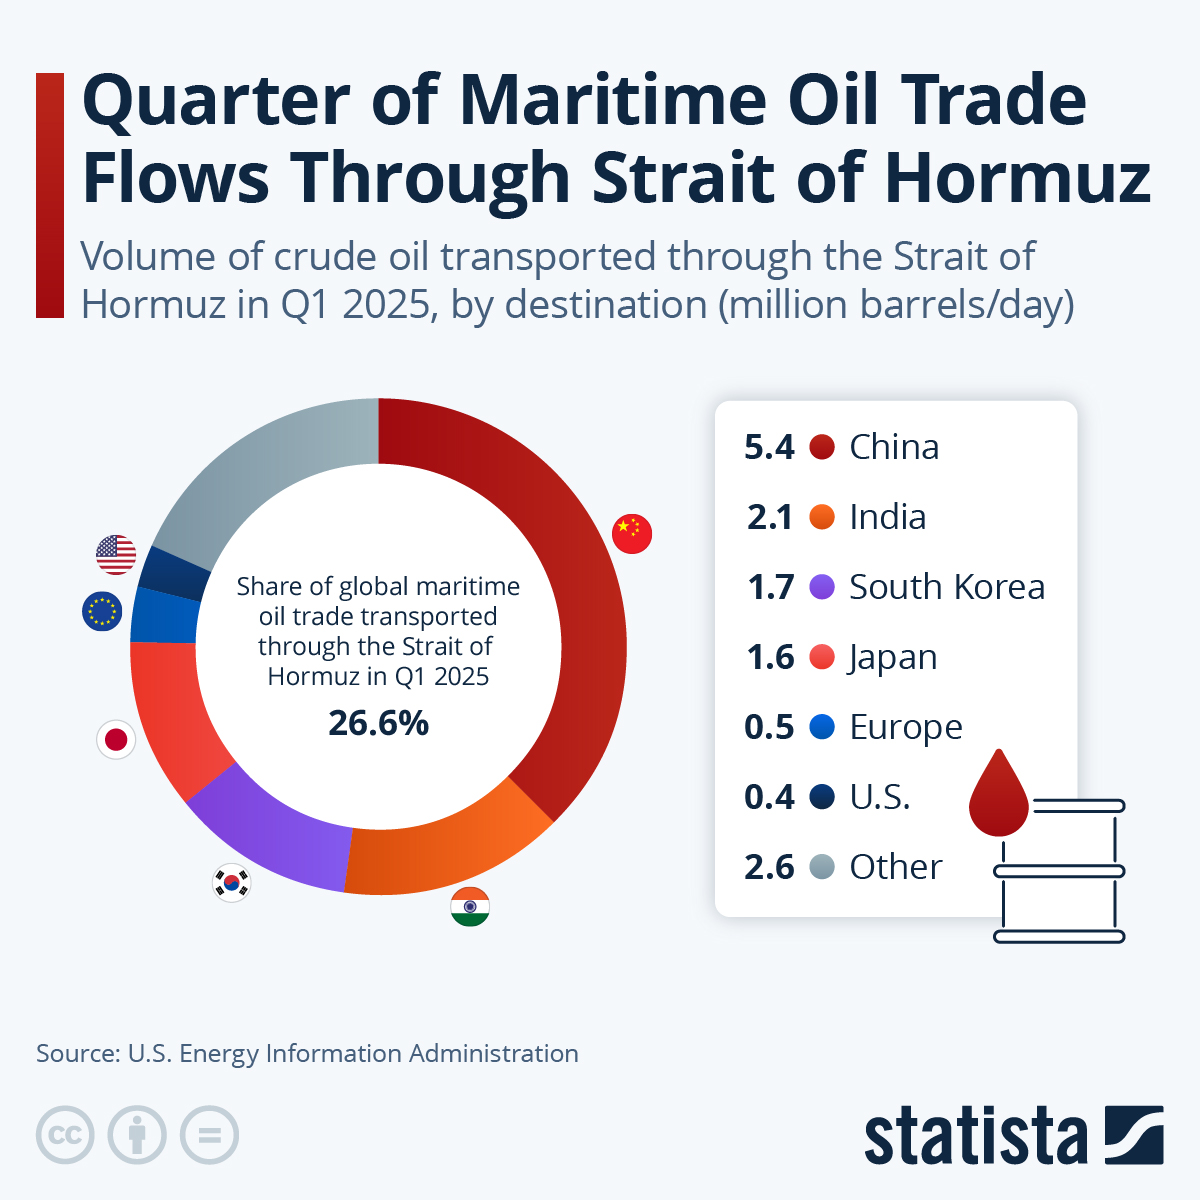
Analysis of viral claims that Trump would impose fees on Strait of Hormuz transits: verification, data on Iran's tolls, and potential market consequences.
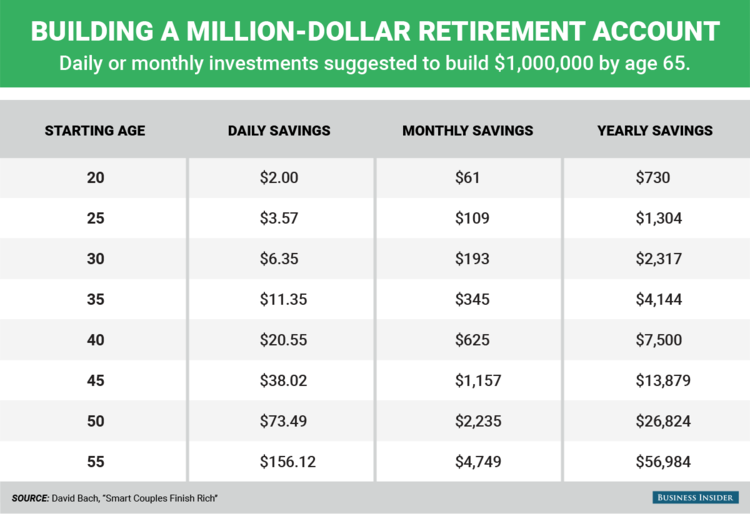
Examines Kevin O'Leary's claim that someone earning $69,000 who invests 20% (~$265/week, $13,800/yr) can become a millionaire —models returns, timelines, risks.
Analysis of President Trump's praise for Palantir and its impact on $PLTR: tweet sentiment shows 26% supportive vs 45% confronting reaction as stock climbs.
Claude agents outperform SPY (+2.68%). Social sentiment ~53% supportive. Portfolio adds NOW & ICE, exits APO & GD. CPI print acts as a tailwind, helping multiples.

Anthropic's Claude Cowork launch drove a ~25% selloff, erasing over $400B in software cap. Analysis explores valuation shifts, casualties, and buy-dip risks.
Gottheimer's Microsoft call-option filing saw 37.08% supportive vs 8.99% confrontational reactions — analysis of market, ethics, and investor sentiment.

S&P 500's April 8 surge after U.S.–Iran ceasefire: market drivers, accuracy of the $1.6T and 6,800 claims, and implications for new highs and sector impacts.
Analysis of a breaking tweet claiming an expected US-Iran deal: sentiment split (Support 18.09%, Confront 56.25%), key claims, and immediate market reactions including falling oil and rising US futures.
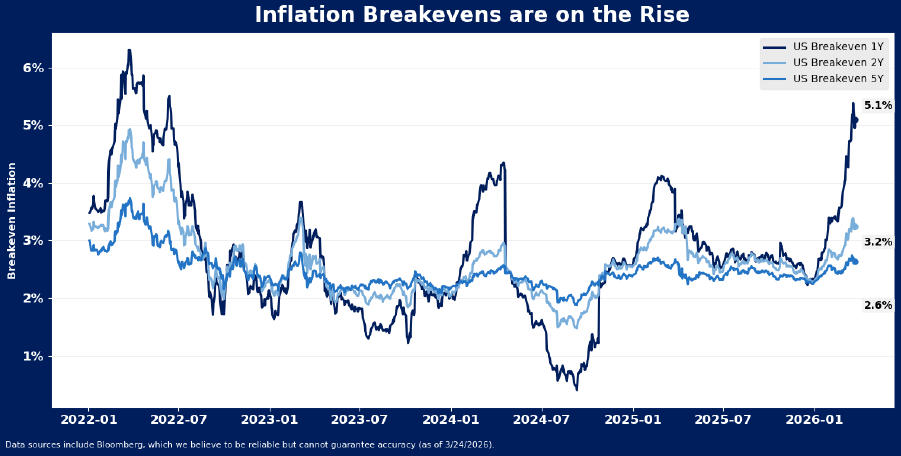
12-month US market-implied breakeven inflation surged to 5.2% in late March 2026 as Brent crude rose above $108–$112/bbl, forcing markets to reprice policy.
Analysis: S&P 500 turns green as Pakistan asks Trump to extend 8 PM deadline by 2 weeks. Sent: 23.48% supportive, 39.33% confront; both sides reviewing.

Tests Tom Lee's claim that markets bottom ~10% into wars, using historical data (including WWII) to see if invasion selloffs reliably create buy signals.
Insiders dumped $3.24B in risk assets pre-market: 150 sells, 0 buys. Sentiment: 65.41% confrontational vs 12.78% supportive — potential market downside ahead.
Analysis of a viral tweet claiming Trump said 'the war in Iran has been won.' Replies: 68.21% confronting, 5.36% supportive — skepticism and market concern.
Sentiment analysis of a viral tweet about a Trump insider's $108M short: mixed reactions - 28.4% supportive, 39.8% confronting. Key engagement insights.
In-depth analysis of Trump's 48-hour warning to Iran, the April 6 10:05 AM ET deadline, the Strait of Hormuz, market-timing overlap and geopolitical risks.

Analysis of Powell's March 18 claim of near-zero net private job creation after Fed adjustments, market reactions, and implications for labor policy and growth.

Federal Reserve Z.1 shows US households' direct and indirect equity holdings hit 47.08% of financial assets in 2025:Q3, released Jan 9, 2026. An all-time high.
Oil closed near $112/bbl as U.S. markets went dark for 63 hours over Easter. With rising U.S.–Iran tensions, Monday’s reopen could trigger a rapid price shock.
Claude's $50,000 experiment: 15 stocks picked by autonomous agents are beating the market by 4%. Sentiment: 52.94% support, 14.12% confront. See full list.

Feb 17, 2026: S&P 500 fell as much as 1.5% then rallied to close up 0.11% at 6,843.51 (+7.34 pts). Analysis of intraday drivers and sector leadership.
Analysis of a tweet on Claude Autonomous Agents running a $50,000 stock portfolio outperforming $SPY. Sentiment 43.94% supportive, 18.18% confronting currently.

Fact-check of a viral tweet claiming Warren Buffett warned a bigger market drop. We examined CNBC and public records, find no evidence, and show how to verify.

Analysis: Trump may halt US campaign vs Iran in 4-6 weeks even if the Strait of Hormuz stays closed - impacts on military goals, markets and diplomacy.
Analysis of a viral tweet linking Iran comments to a rapid S&P 500 reversal: support 53.3% vs confront 19.1%. Covers timing, market swing and sentiment.
Tweet analysis: Haifa Port refinery stock fell 4% after Iran strikes. Sentiment: 37.5% supportive, 10.58% confronting. Supportive and confronting examples listed.
Analysis of a viral tweet where Iran's Speaker advised reversing pre-market 'news' moves—pump, short; dump, long. Sentiment: 39.67% support, 17.91% confront.
Analysis of April 9, 2025 S&P 500 surge: +474.13 points (+9.52%) after Trump's 90-day pause on reciprocal tariffs. Data-driven analysis of market drivers.
Analysis: Tweet on Anthropic's Claude Mythos leak shows 46.91% support and 26.55% confront; reports $14.5B lost from cybersecurity stocks and major firm drops.

Mar 2025 saw the S&P 500 fall ~5.75%, finishing the quarter down ~4.6%. The index entered correction Mar 13 after post-Feb 19 drop; 2 of 11 sectors gained.
Tweet analysis: 35.14% supportive, 24.32% confronting. Sentiment and reactions to Trump's comment on expecting a larger stock market drop, with examples.
Trade[XYZ] and SPDJI launched the S&P 500 perp (US500) on Hyperliquid, offering 24/7 access anchored to official index data and deep institutional liquidity.
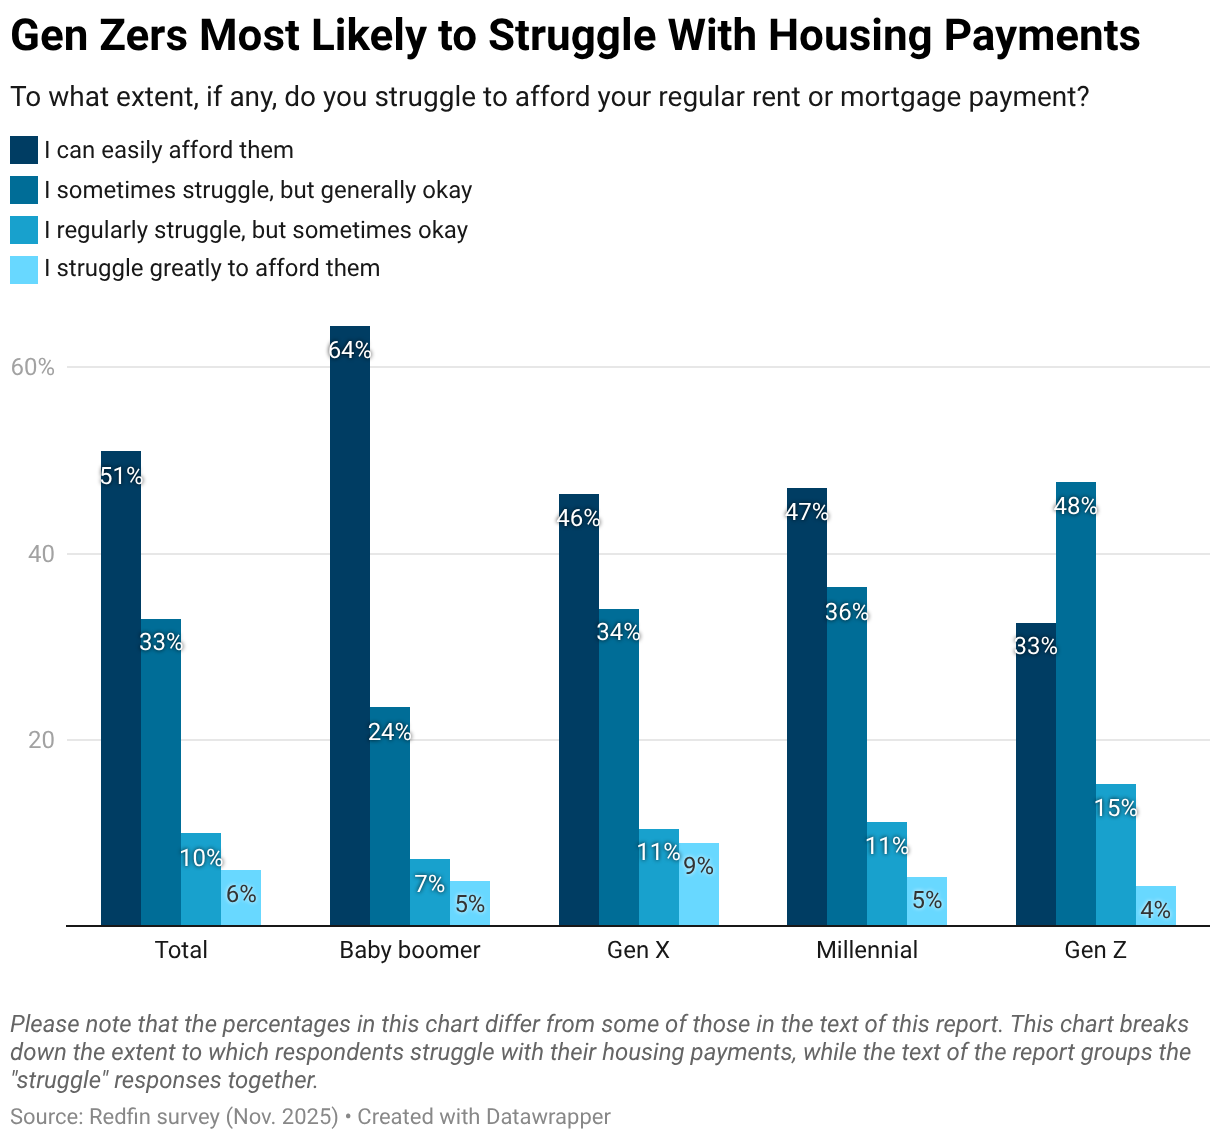
Redfin survey shows 67% of Gen Z struggle with rent/mortgage vs 53% of millennials/Gen X and 36% of boomers. Analysis explores causes and investing solutions.
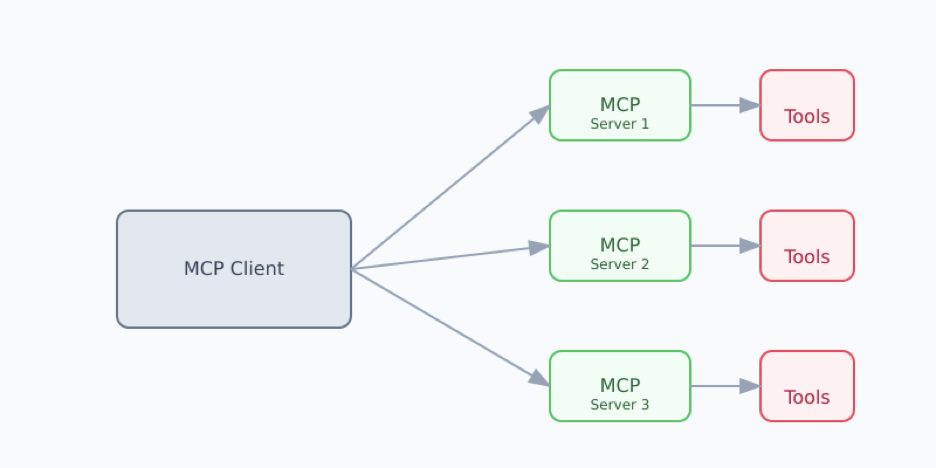
Unusual Whales MCP connects AI to live options flow, dark-pool trades and 41 stock endpoints—enabling real-time screeners, trading bots, and dashboards.
SpaceX IPO tweet drew 50% supportive replies and 12.81% confrontational ones. Quick analysis of public sentiment and key reaction highlights with takeaways.
Viral tweet says Trump will announce a ceasefire. Sentiment: 62.37% confronting vs 11.83% supporting — strong skepticism despite 'bullish' market claim re: Iran.

March 19 oil swings: WTI topped $101, settled at $96.14 and slid toward $94; Brent spiked above $119 amid U.S.–Israel–Iran tensions and broader market reactions.
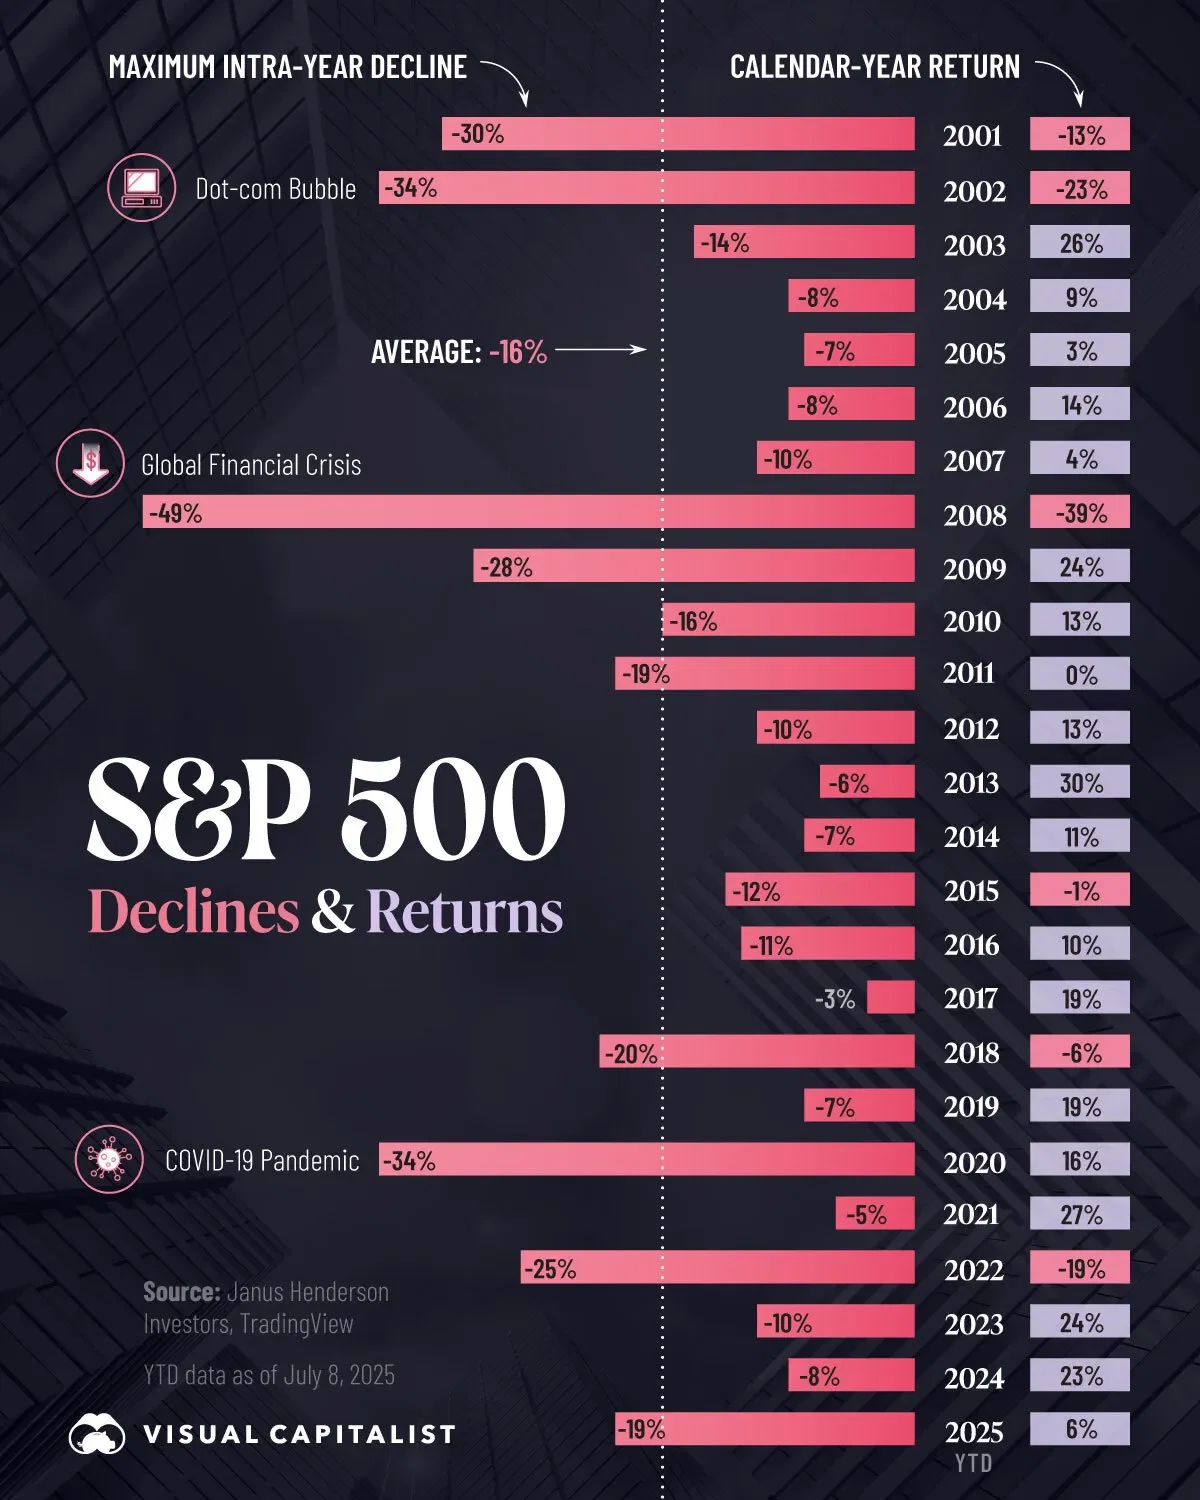
Examining the viral Peter Lynch quote, its origin in an Oct 1994 National Press Club talk, and the historical frequency of 10% and 25% stock-market declines.

Data-driven look at the viral '4% rule' claim: Bengen's 1994 backtests, 30-year horizons, inflation-adjusted returns, and modern diversification & risk caveats.

Trump's 5:13 PM ET Truth Social post about 'winding down' in Iran sent SPY up over 1% after-hours. Analysis of price moves, volume, timing, and market drivers.
Data analysis: a 2% S&P 500 decline on a ~$55–58 trillion base erases about $1.1–$1.17 trillion. We explain the math, data sources and market implications.

Analyze March 20, 2025 flash crash that erased ~$600B from U.S. market cap in ~50 minutes. Review S&P futures (4:40–6:20 ET), data trends, causes and risks.
Tweet predicting an S&P 20% drop draws mixed sentiment: 34.98% support vs 41.70% confrontation. Analysis highlights debate and example reply types across X.
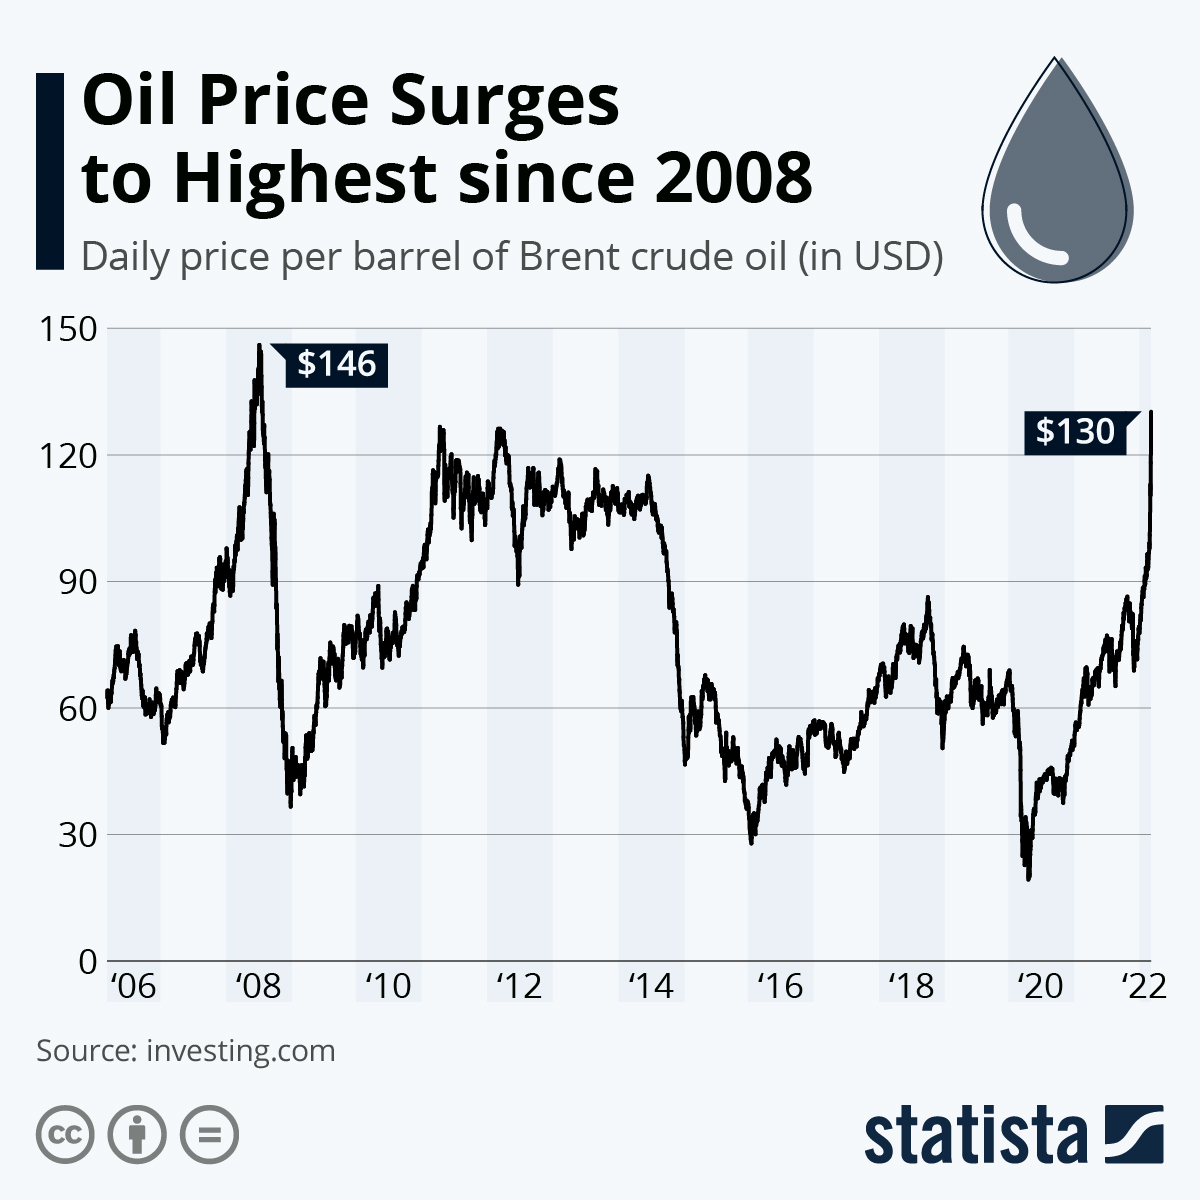
Brent crude spiked to ~$119/barrel after Israeli strikes and Iranian retaliation on Gulf energy infrastructure. Market data, supply-risk analysis and outlook.
Sentiment analysis of Trump's tweet dodging a troop question by citing the Dow. Support 53.46% vs Confront 16.35% — reaction breakdown and key takeaways.
Analysis of a historic GS note: LOs net sold $9.6B in a 5-sigma floor flush. Social sentiment: 33.82% supportive, 22.06% confronting. Market impacts. Outlook.
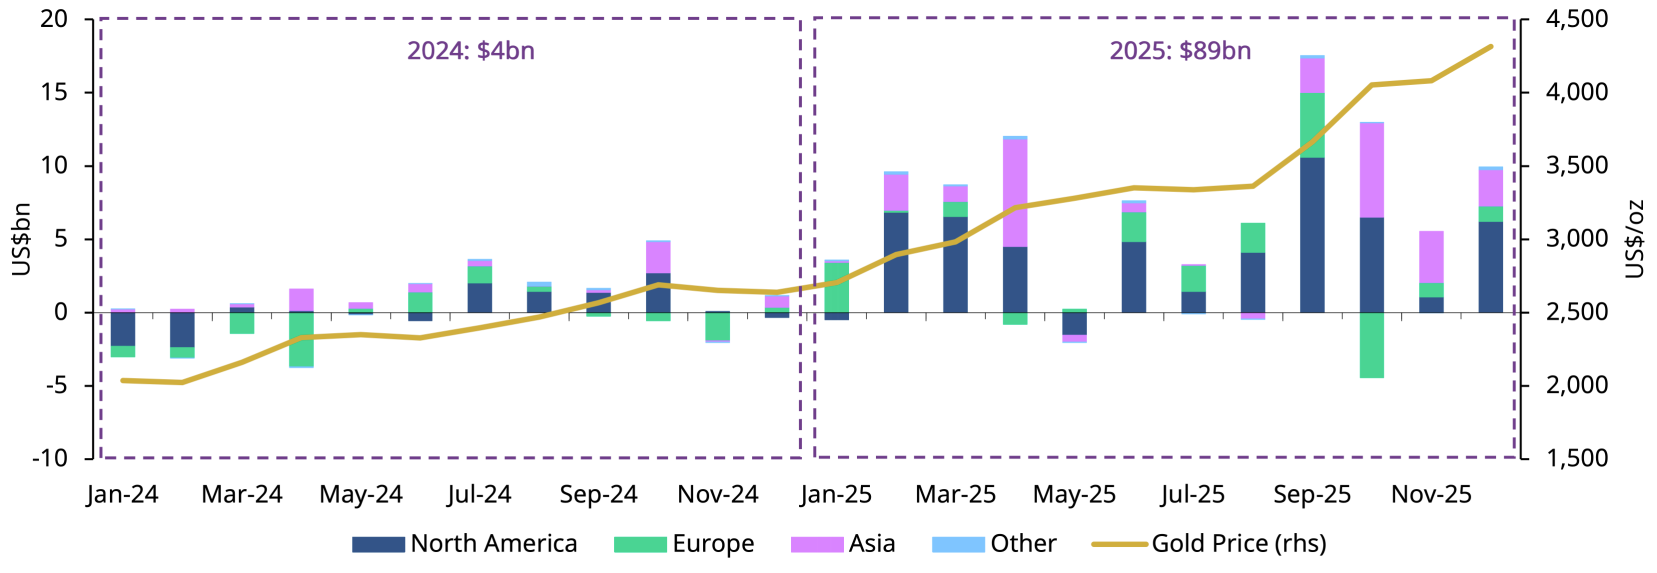
Analysis of retail-driven gold and silver ETF inflows since mid-2025 - unpacking +$70B retail gold buys, institutional selloffs, and implications for markets.

March 2026 drop: Dow fell ~6.03% (2,956 points) from Feb 27 to Mar 19. If so, it would be the index's worst monthly decline since 2022, surpassing Dec 2024.
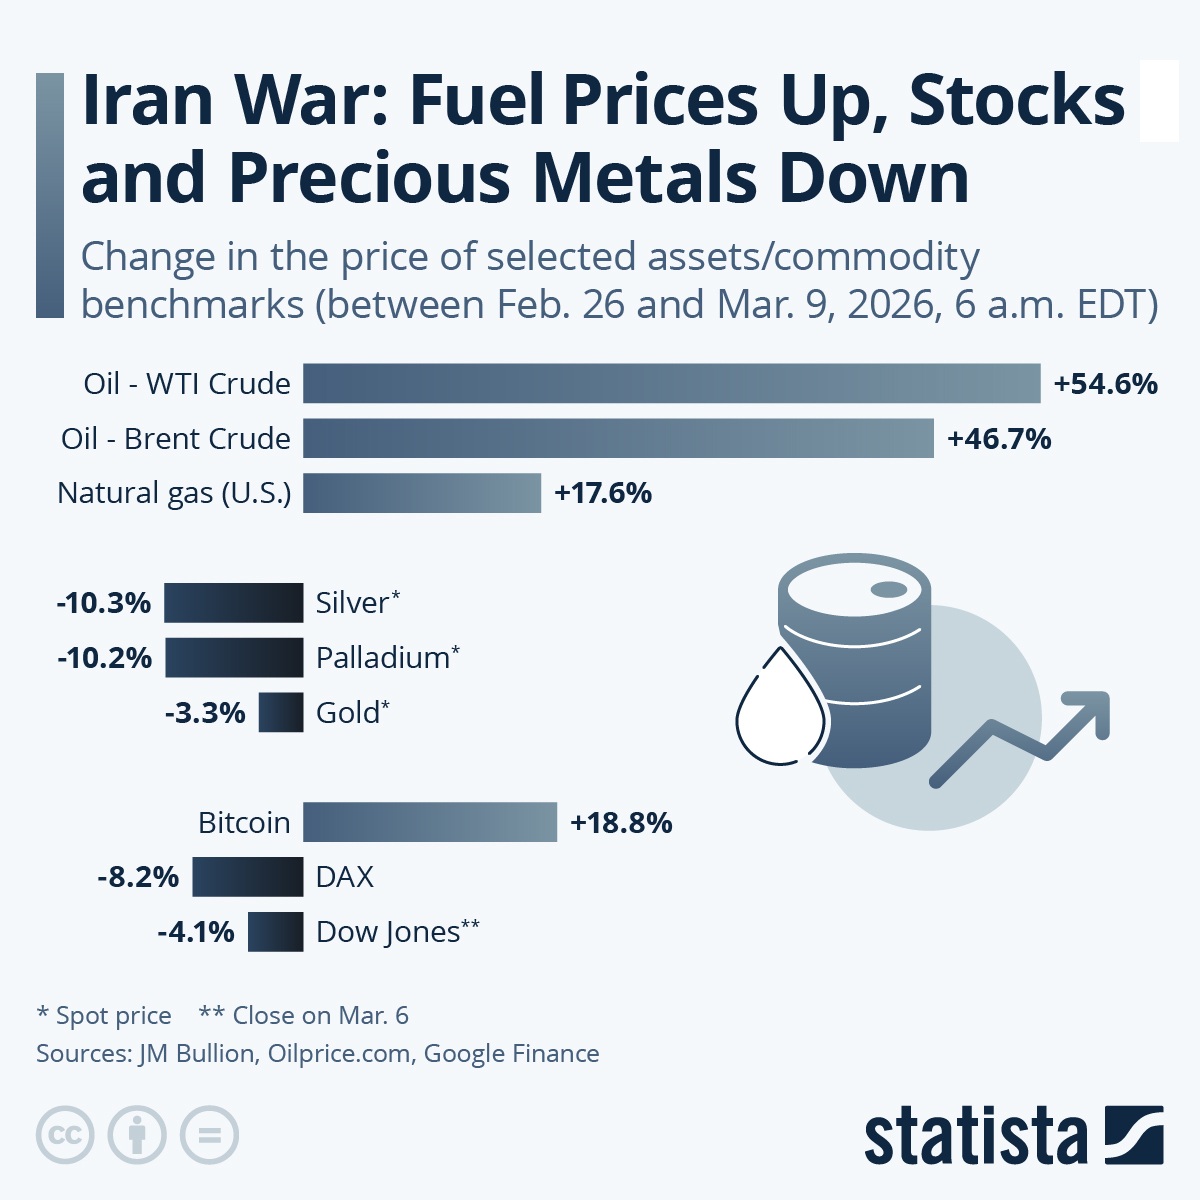
S&P 500 flipped from -1.5% to +0.8% on March 9, 2026 as WTI plunged from $119.48 intraday back below $90 — showing equities' growing sensitivity to oil shocks.

Analysis after the Dow plunged 768.11 pts to 46,225.15 on March 18, 2026 — sector impacts, index comparisons and near-term outlook with trading data now.
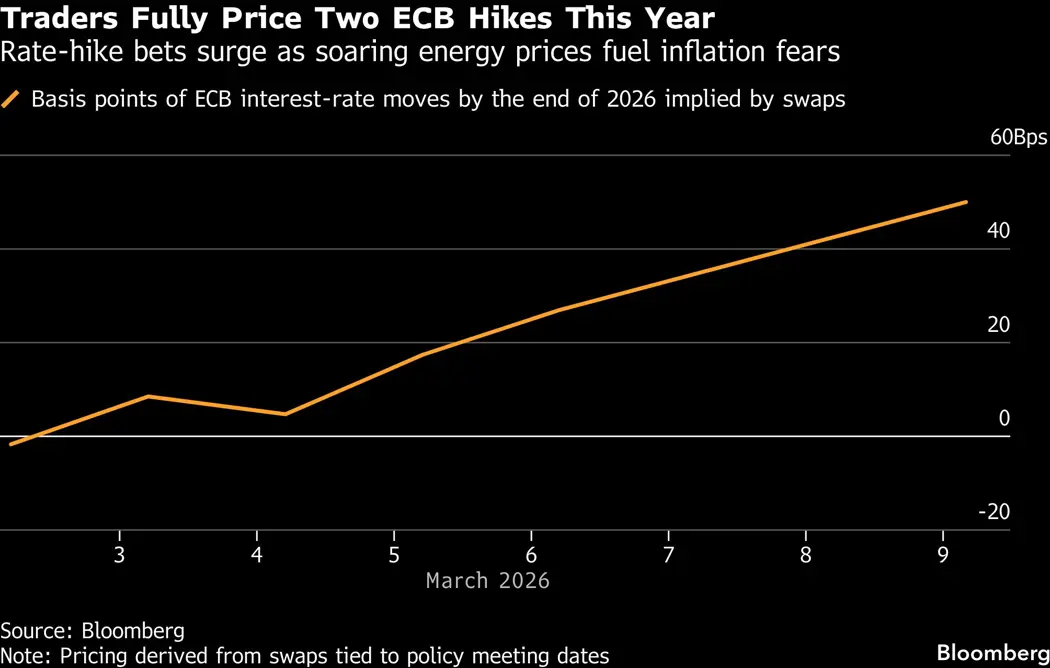
Bond markets repriced ECB policy after a March 2026 oil shock that pushed Brent near $120. This analysis summarizes market moves, timing and policy impact.

U.S. core PPI rose to 3.9% YoY in Feb 2026, above 3.7% estimate and up from 3.6%. This analysis explains causes, month-on-month moves and market implications.
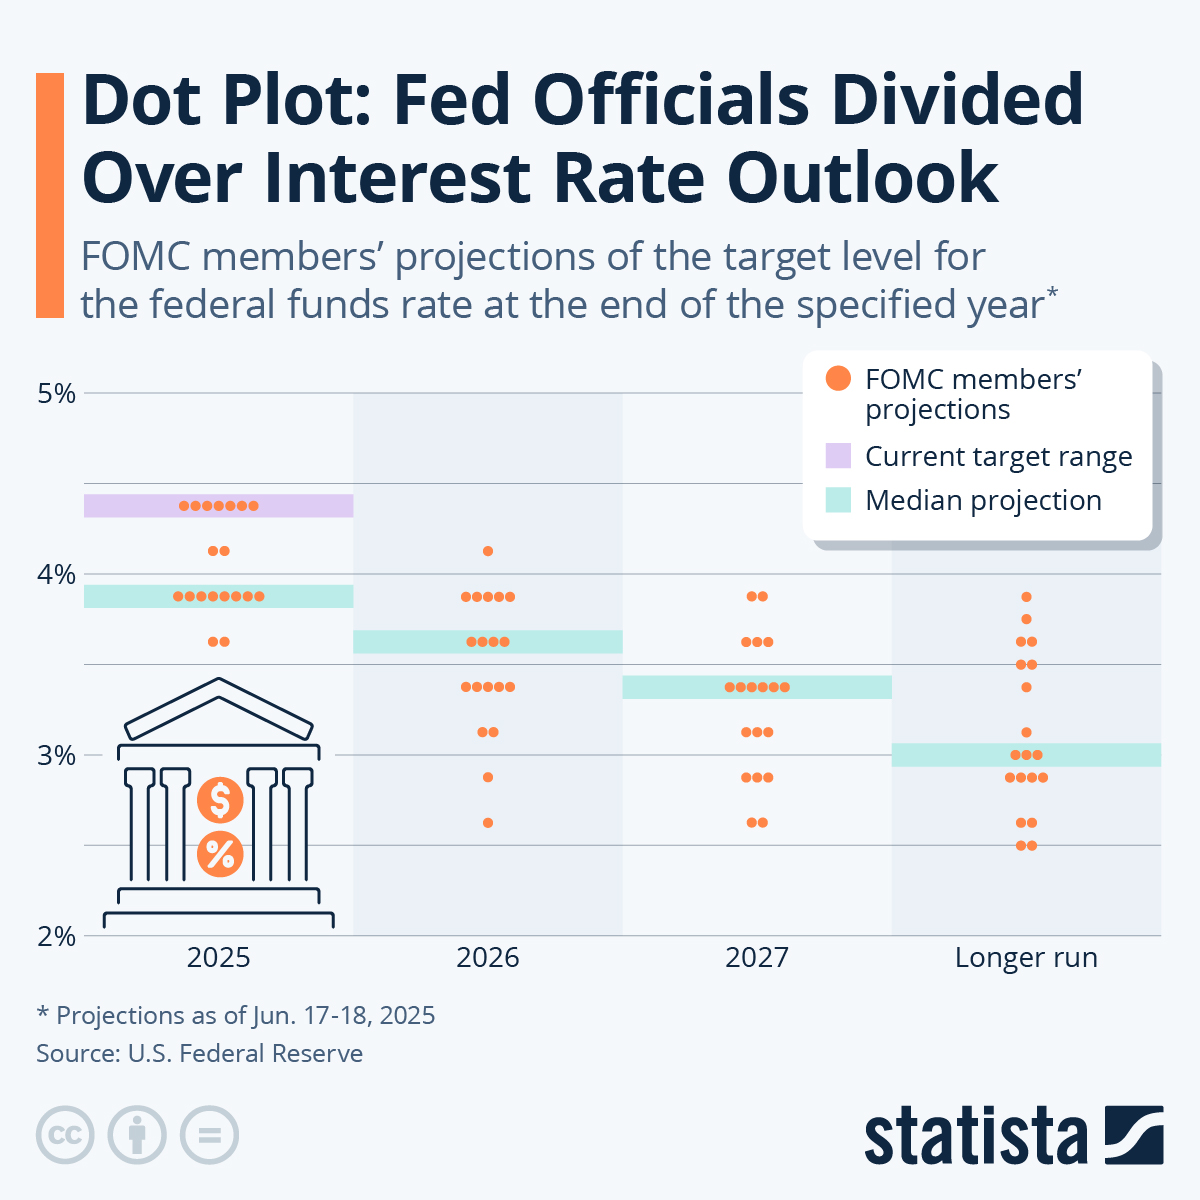
Analysis of the Fed's March 18, 2026 decision to pause rates at 3.50-3.75%, an 11-1 vote, higher 2026 PCE inflation to 2.7%, and projected cuts in 2026-27.

Infographic: market rebound after Iran shock: S&P's 1.2% surge, Brent pullback, and why long end-of-day upper wicks may show rebounds met by sellers in charts.
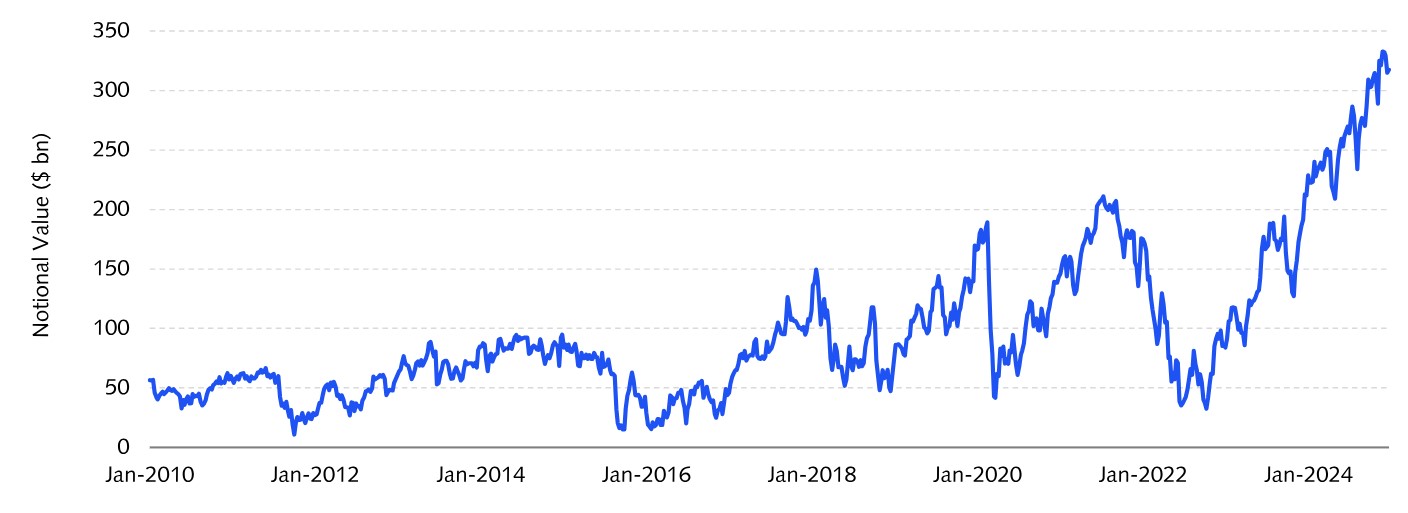
CFTC COT (Mar 10): Asset Managers cut 89,855 E-mini S&P 500 longs and added 16,061 shorts — a net reduction of ~105,916 contracts, a record weekly selloff.

Infographic: HALO trade rotation explained - data breakdown of why investors favor Heavy Assets, Low Obsolescence sectors and Goldman’s short signal. With charts.
Infographic: data-driven look at economic and financial risks from the Middle East war—oil exports, market volatility, sanctions, and post-March 2026 tipping risks.

Infographic: AAII shows cash at 14.2%, lowest in 4 years vs 22.5% avg. We analyze historical precedents, heightened investor risk appetite, and S&P 500 risk.
Infographic: March 17-18, 2026 FOMC - Powell's first comments since the US-Israel strikes. Markets expect no cuts; oil surge raises inflation risk near-term.

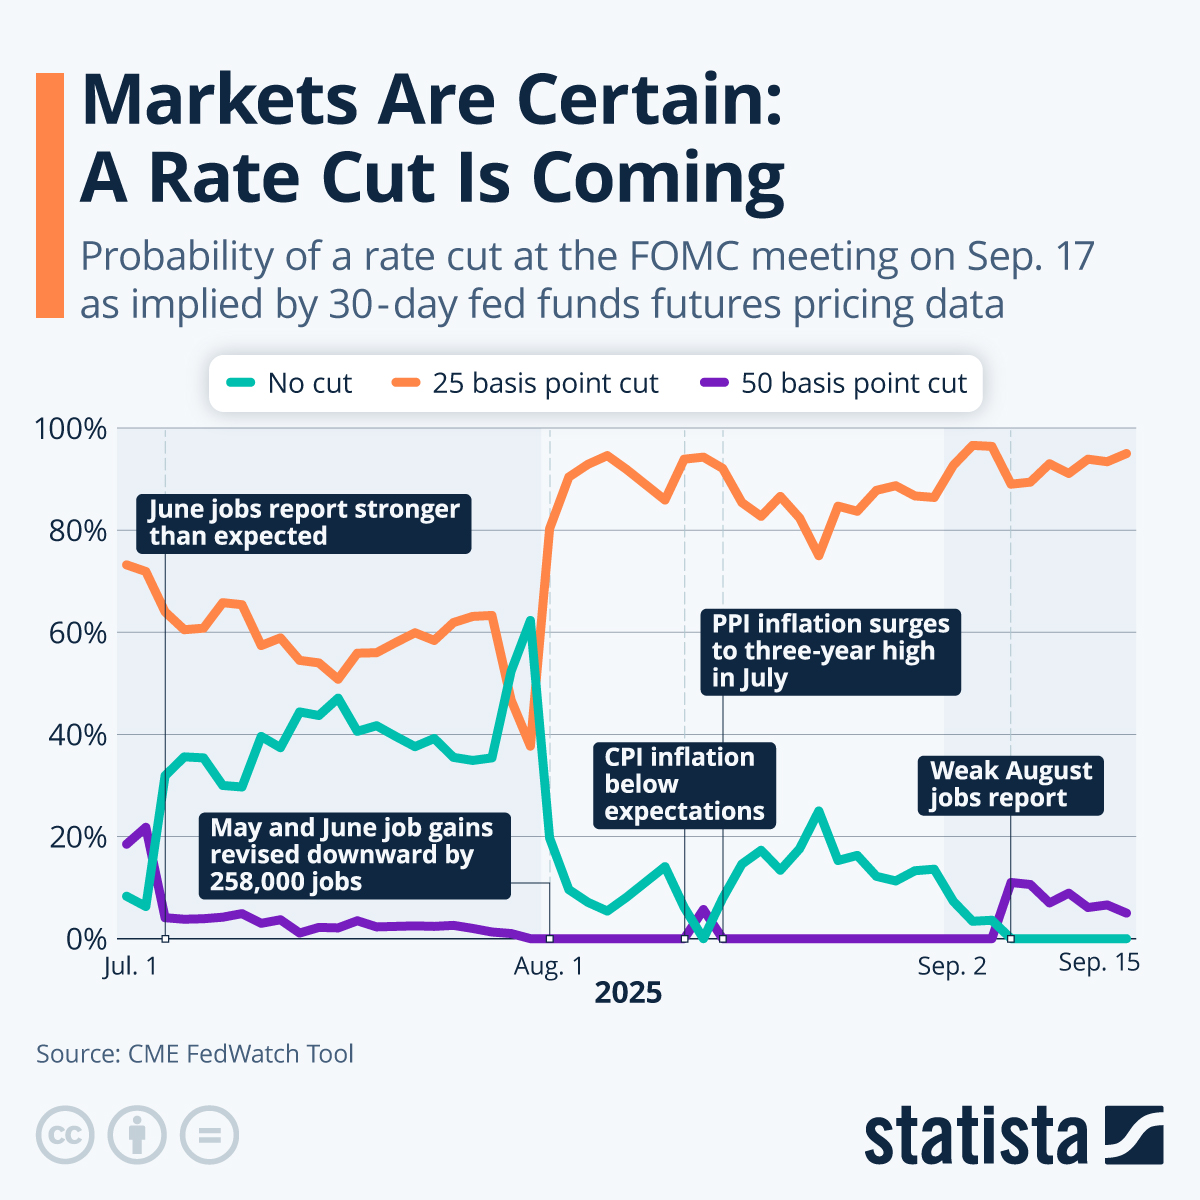
Infographic debunks a viral claim that the Fed 'cancelled' rate cuts. View market-implied probabilities, timeline, and what the March 18, 2026 FOMC means.
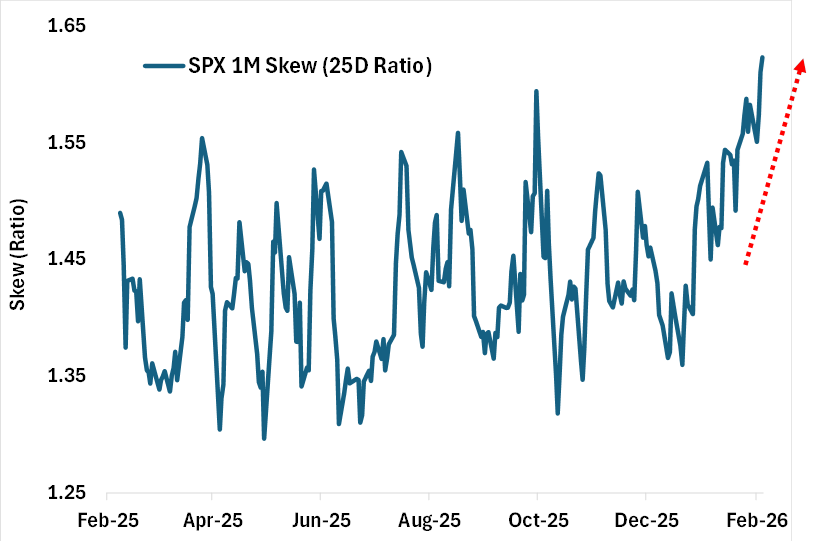
Infographic: investors rush to hedge U.S. equities - 1-month S&P put-call skew ~12, ETF shorting surges, and ETFs made up >35% of trading for 11 straight days.
Infographic: Goldman's Tony Pasquariello warns 'tails are getting fatter' — markets may underprice downside risk. Data on Feb 5, 2026 fund losses & indicators.
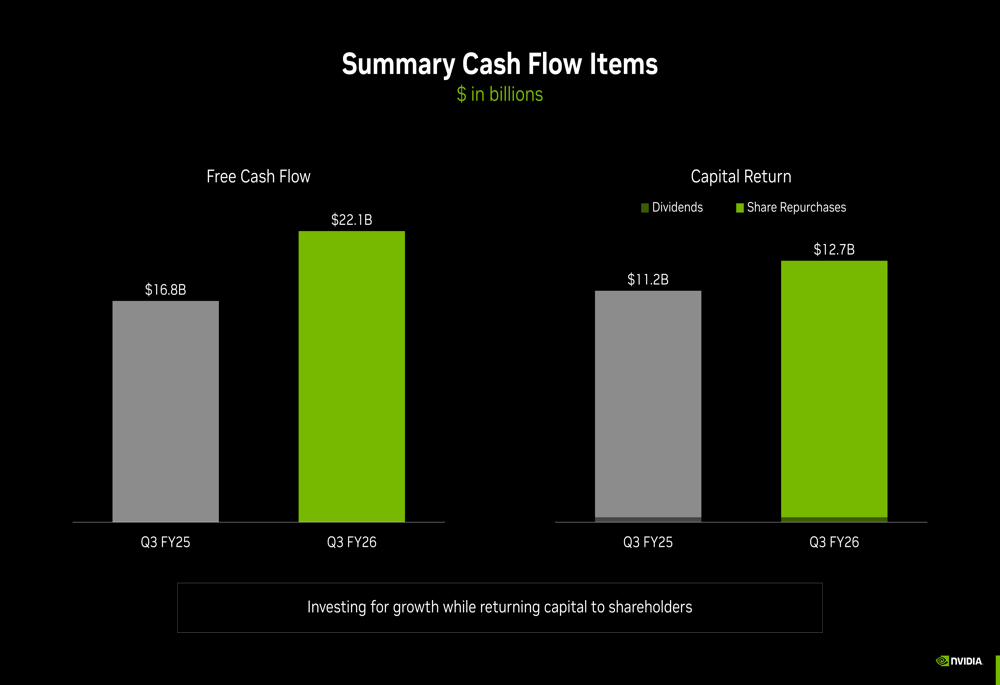
Infographic: fact-check of viral March 17, 2026 claim that Nvidia will return 50% of FCF via dividends and buybacks — official filings show no such policy.
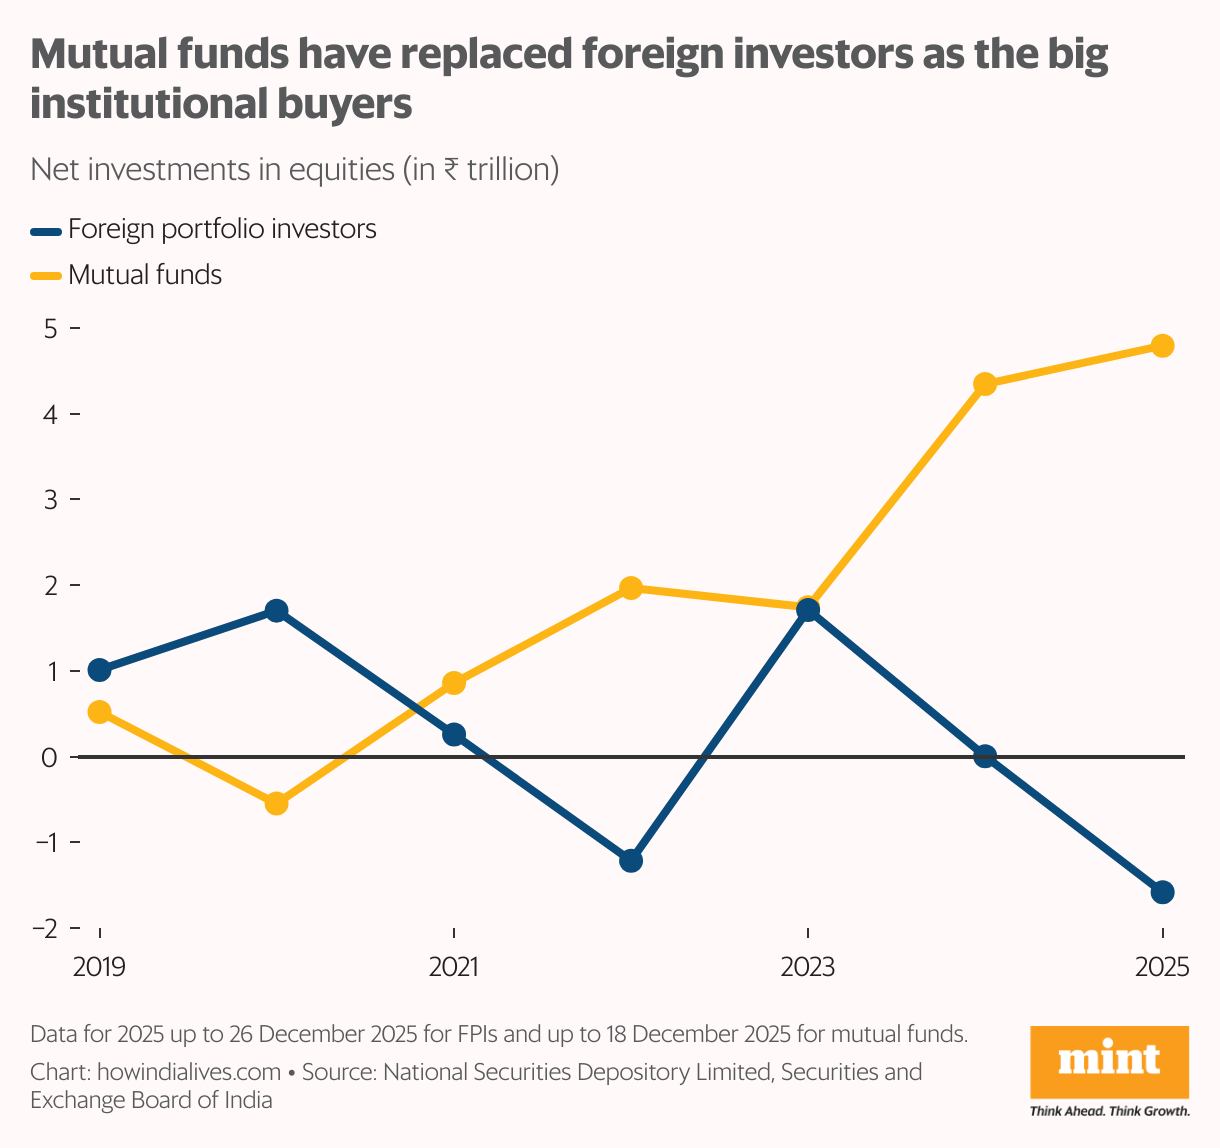
Infographic: FPI selling trends since 2018—data-driven look at LTCG/STT policy effects vs valuation explanations, including ₹3.5 lakh crore outflows in 2021–22.

Infographic analysis: Middle East war drives economic and energy tipping points, oil spikes, supply shocks and cascading market risks, backed by industry data.
Infographic: Trump's 2026 stock rally claims vs. data — S&P 500 hit 7,000 (Jan 28), Dow topped 50,000 (Feb 6). We unpack gains, dates, and tariff claims.