JUST IN: S&P 500 reaches new all-time high of 7,200 https://t.co/7PHM5Y7V0h
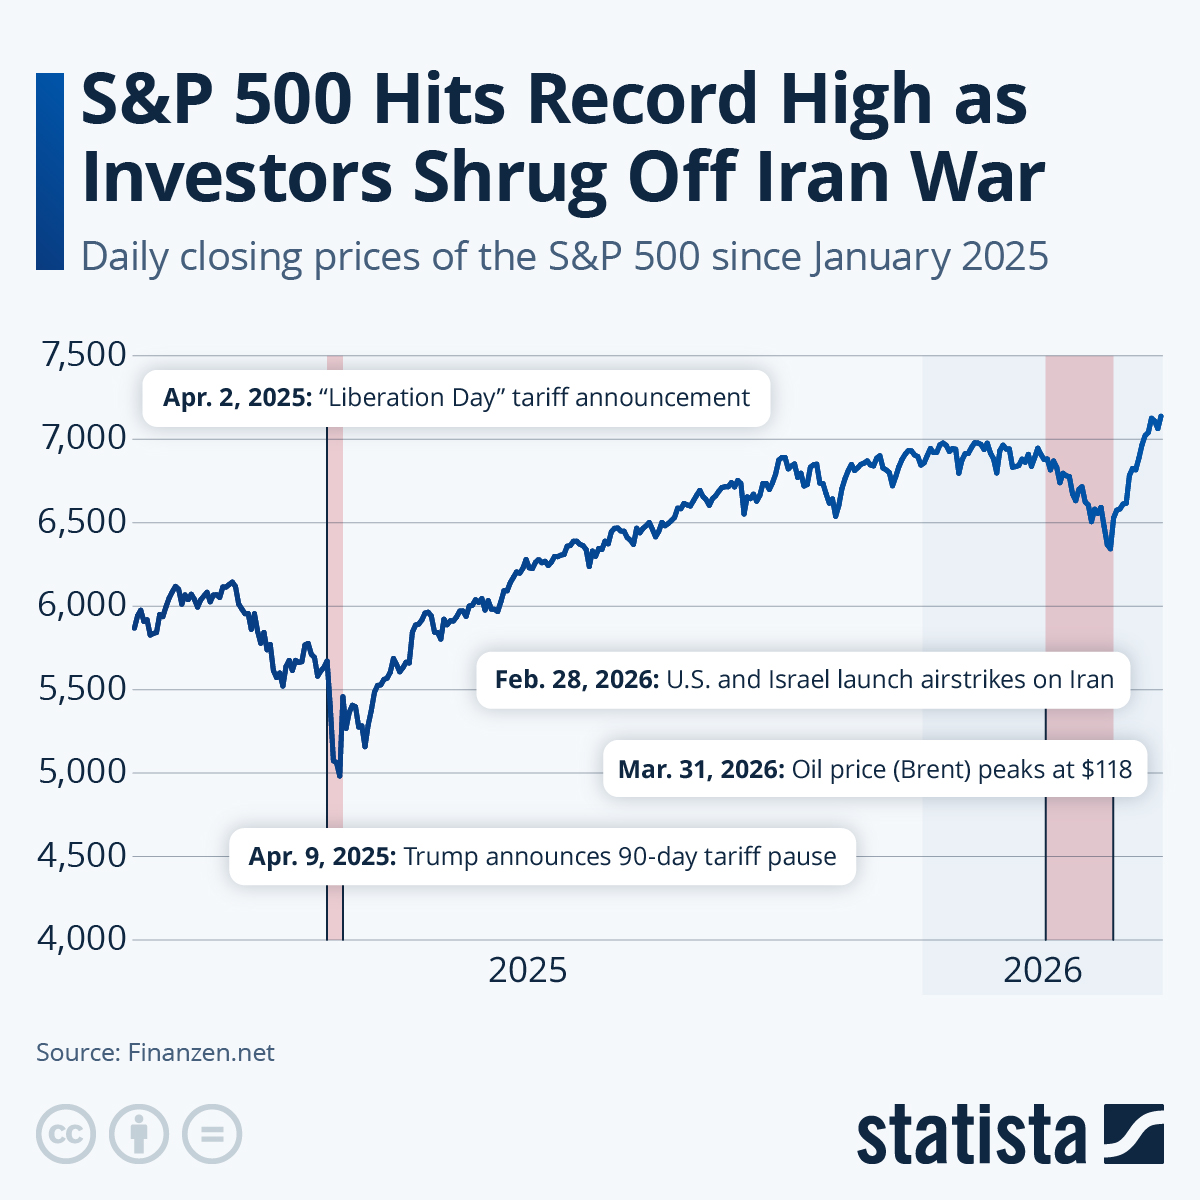
A Statista line-chart infographic titled "S&P 500 Hits Record High as Investors Shrug Off Iran War" showing daily closing prices of the S&P 500 since January 2025 with annotated events; it visualizes the index’s climb into 2026 and the move above 7,000, directly illustrating and supporting the tweet’s claim of a new all-time high near 7,200.
Source: Statista
Research Brief
What our analysis found
The S&P 500 shattered the 7,200 barrier for the first time on April 30, 2026, closing at a new all-time high of approximately 7,209–7,210 points after climbing 1.02% on the session. The milestone capped what became the index's strongest month since November 2020, with a staggering monthly gain of 10.4% in April 2026. The broader rally lifted other major indices as well: the Nasdaq Composite reached fresh highs at 24,892.31, while the Dow Jones Industrial Average surged 790 points to close at 49,652.14.
The record-setting session was fueled primarily by robust corporate earnings, particularly from Alphabet, which surged nearly 10% after reporting better-than-expected profits driven by massive AI investments. The company announced capital expenditure plans of up to $190 billion for 2026, underscoring what analysts are calling the defining "AI buildout" story of the year. Federal Reserve Chair Jerome Powell's signals that the tightening cycle was "firmly in the rearview mirror" further bolstered investor confidence.
However, not all signals were bullish beneath the surface. U.S. GDP grew at just a 2% annualized pace in Q1, slightly below expectations, while core PCE inflation accelerated to 3.2% in March. The S&P 500's Shiller CAPE ratio hovered near 36.48, prompting some analysts — including those at Goldman Sachs Research — to warn that the market may be "priced for perfection" and to expect lower returns and increased volatility in the second half of 2026.
Fact Check
Evidence from both sides
Supporting Evidence
Multiple sources confirm the all-time high
Investing.com reported the S&P 500 closed at 7,210.24 points on April 30, 2026, "surpassing the 7,200 mark for the first time ever and notching a record close." Other outlets corroborate a closing value of approximately 7,209.01.
Phemex News independently verified the milestone
The outlet stated on April 30, 2026, that "The S&P 500 index has reached a new all-time high, closing at 7,200," aligning with the tweet's claim.
Strong corporate earnings drove the rally
Alphabet surged nearly 10% on better-than-expected profits fueled by AI investments, while Caterpillar also posted significant gains after strong quarterly results, providing fundamental justification for the new high.
Broader market indices confirmed bullish momentum
The Nasdaq Composite and Dow Jones Industrial Average both reached fresh highs on the same session, with the Dow gaining 1.6% and posting its best month since November 2020.
Federal Reserve policy supported the advance
Fed Chair Jerome Powell hinted that the tightening cycle was "firmly in the rearview mirror," contributing to investor optimism and the record-breaking close.
Contradicting Evidence
Several major tech stocks declined despite the rally
Not all components shared in the gains — Meta dropped 8.6% due to concerns over soaring capital expenditure and softer user growth, Microsoft slid nearly 4%, and Nvidia also saw declines, suggesting the rally was not uniformly broad-based.
Economic data showed mixed signals
U.S. GDP grew at only a 2% annualized pace in Q1 2026, slightly below economists' estimates, while core PCE inflation jumped to 3.2% in March, accelerating from February and raising questions about the sustainability of the expansion.
Valuation concerns persist among analysts
The S&P 500's Shiller CAPE ratio was near 36.48, leading critics to argue the market is "priced for perfection." Goldman Sachs Research analysts expect lower index returns than in 2024 and increased volatility in the second half of 2026.
Geopolitical risks introduced early session volatility
Tensions in the Middle East caused fluctuations in oil prices during the trading day, highlighting that external risks remain a factor even as markets reached new highs.
Report an Issue
Found something wrong with this article? Let us know and we'll look into it.